Welcome to hasOptimization!
We’re so happy to have you as a client!

As a hasOptimization client, you will be receiving customized reporting based on how your campaign(s) are performing. We just wanted to take a moment to go over how the reports look, what you will be receiving, and address any possible questions you may have about your reports.
Let’s get started!
WYSIWYG Reporting
WYSIWYG (What You See Is What You Get) Reporting is a way for us to compile reports automatically that gives you accurate numbers based on how your campaign is performing. We provide reports to you for the previous month’s data, conveniently sent to your email.

How does it come?
We send out reports to you via your email. When it comes to you, you will receive a link that you can click via your leisure.

What’s in it?
Your custom report is chock full of information that can help you decide what you next business move might be.

Google Analytics
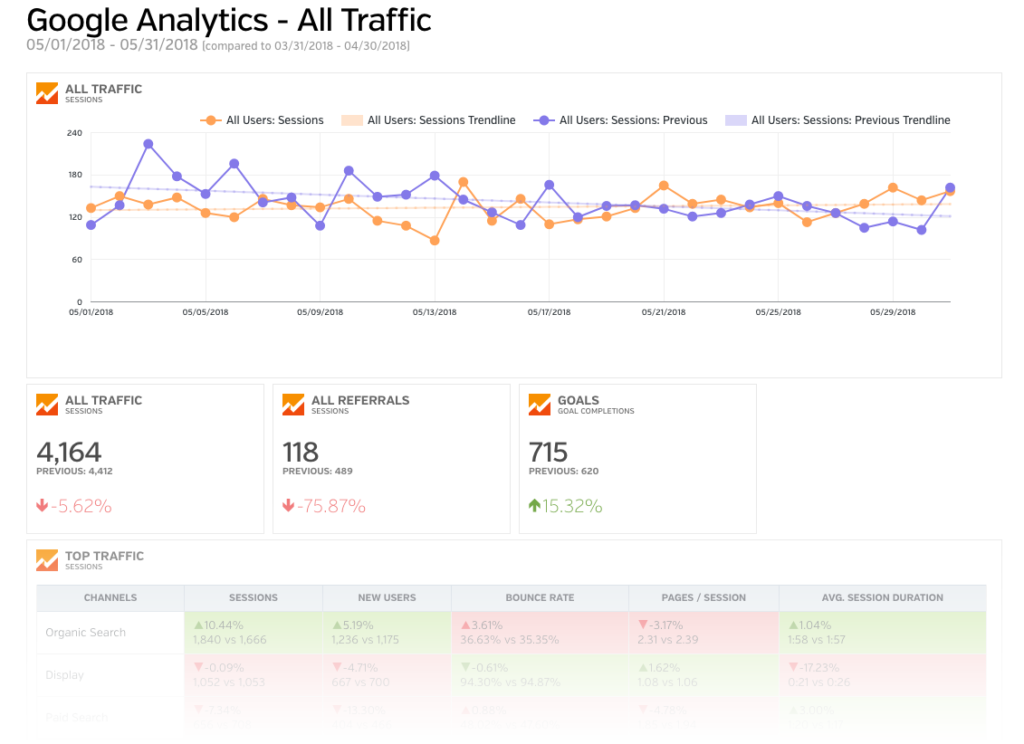
This is your site’s overall performance, including new visitors and returning visitors. You can see most analytics data here including where your traffic is coming from, and whether you’re doing better than last month (green) or worse than last month (red).

Adwords & Advertising
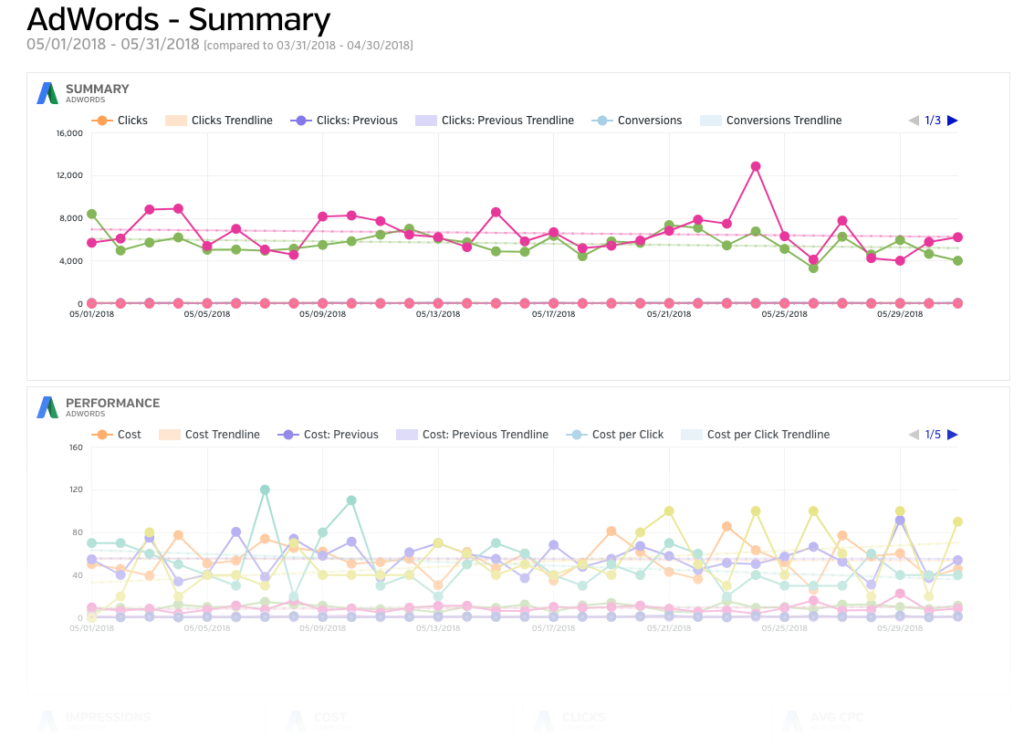
If you have advertising campaigns, you will see them in a section like this one. We will include Google AdWords campaigns and Facebook Ads in this report.

Social Media Performance
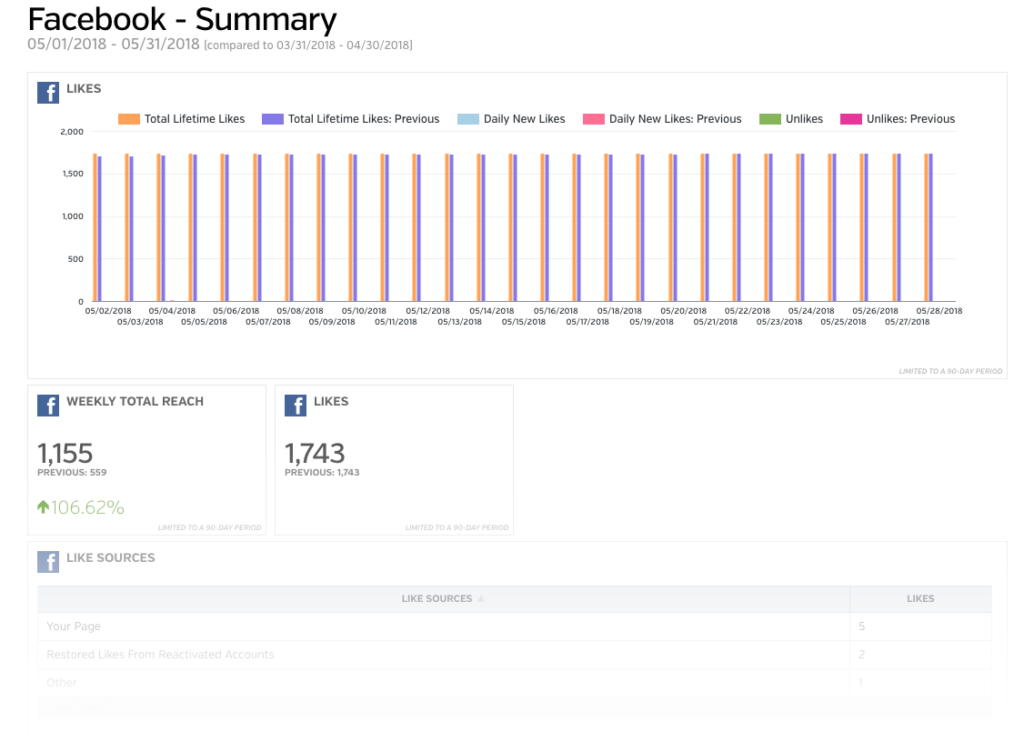
Last but certainly not least, you will see sections for your various social media platforms. You will see your Facebook, Twitter, YouTube, and LinkedIn metrics here.
What should I expect?
For your first report, you may find data within the reports is limited. Sometimes we don’t connect the accounts or we don’t get access to the accounts until mid-month, and therefor your very first report may be entirely incomplete. That’s why we encourage you to look at the report as soon as you get it to get used to the look and feel of it, but keep in mind reports for the next month and beyond may be more complete than your first one.

How to Navigate Your Report
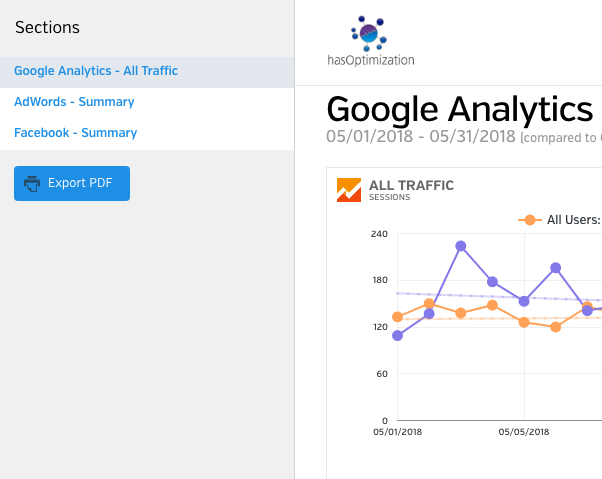
Navigating your report is super simple! Simply look for the sidebar on the left and you can click through each section to get to them quickly or you can simply scroll down until you get to where you need on your report. You can also export your report to PDF if you want to share it with others or print it (or save it for later).
